The price-to-earnings (P/E) ratio is the market price of a security divided by its net income. The forward P/E ratio is similar, but it uses the forecasted (or “forward”) earnings estimates for the security as the denominator instead of the earnings from the previous period.
The forward P/E ratio is a great starting point for understanding the fundamentals which underpin both individual companies and indexes. On the index level, forward four quarter earnings estimates are generated by taking the consensus earnings estimate of each specific stock within an index; these estimates are generated by averaging the earnings estimates of all the sell-side analysts that cover a given stock. The consensus estimates are then used to build the estimation of future earnings for the entire index.
The forward price-to-earnings ratio allows investors to look at an investment’s market price in the context of the earnings the investment is projected to produce. When an index is trading at 20x forward earnings that means at the projected level of earnings next year, it would take 20 years for the index to produce income equal to its current market capitalization. This is valuable because it gives you a concrete way to think about market pricing that aligns the forward-looking nature of financial markets with the fundamentals that drive investment performance.
The ratio also informs you of what other market participants are willing to pay for a given security. This is especially helpful to look at in the context of market conditions. For example, if the forward P/E ratio of a major index is above its long-term average as economic conditions are improving and the outlook is strong, the price of the index could be seen as rational and properly valued. However, that same forward P/E during a weakening economy and a poor outlook could indicate that the current market price on the index may be too high given the economic backdrop.
Comparing forward P/E ratios of various indexes tracking different market segments lends insight into what market participants are willing to pay for those various segments. While each index’s long run average forward P/E is different, divergence from these averages can tell you which market segments are currently favored and can potentially aid in determining which segments are under or overvalued. Keep in mind, however, that the forward P/E ratio uses an estimated earnings figure which will always be subject to change and estimation error.
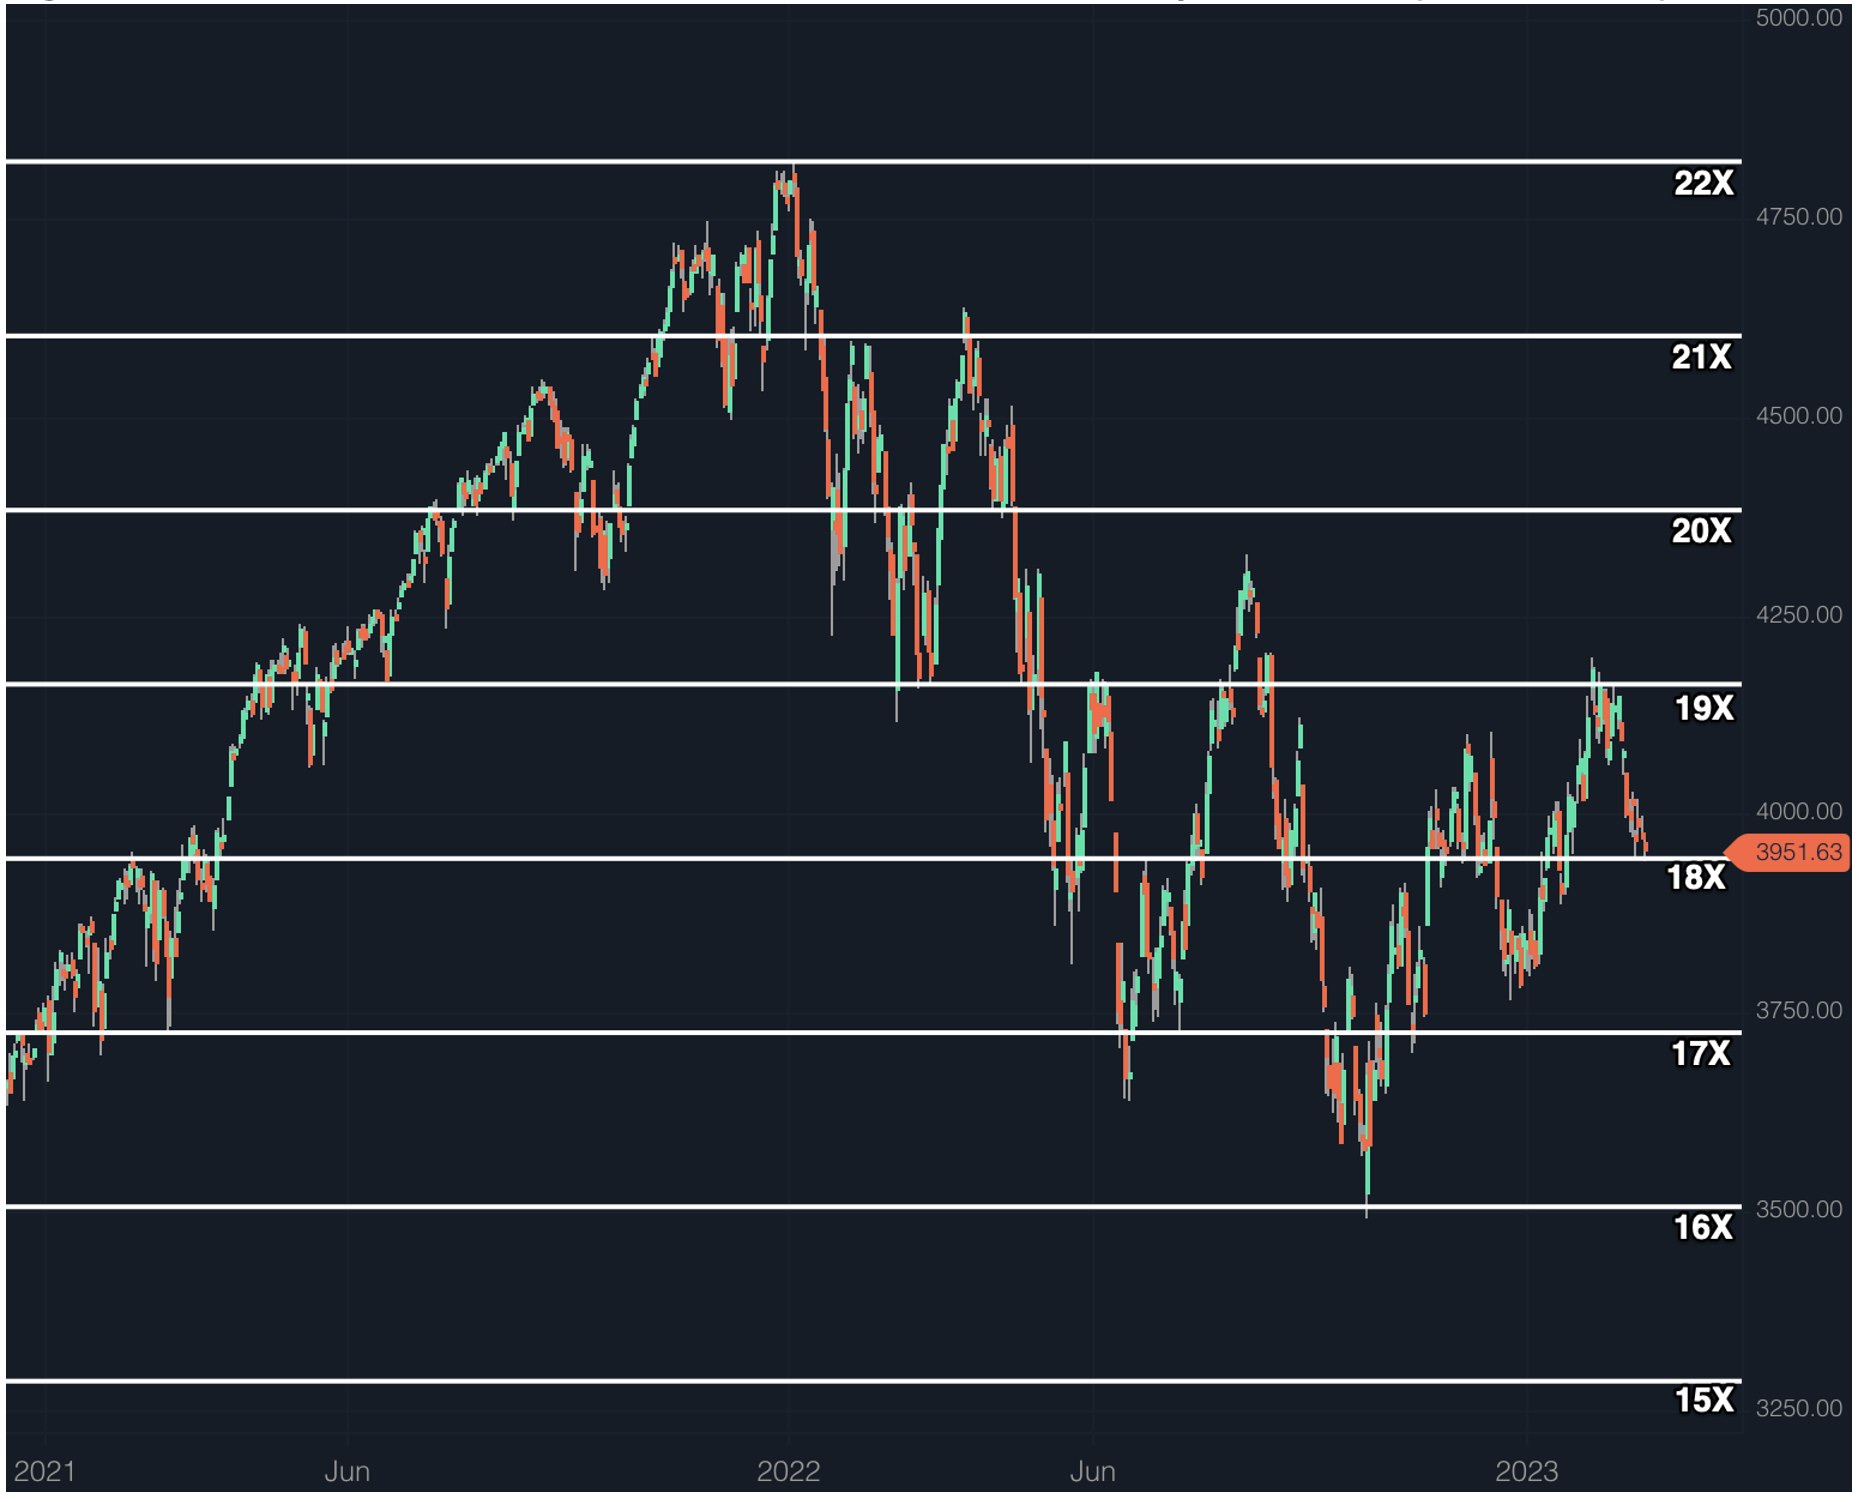
As we reach the tail end of Q4 2022 earnings, the current forward four quarter earnings estimate for the S&P 500 is $219.13, according to S&P Global. At market close on March 1st, 2023, the index is trading at $3,951.39, representing a forward P/E of 18.03 (figure 1). This is above its long run average.1

Data source for the graph is S&PGlobal.com.
1 "Stock Market Briefing: Selected P/E Ratios" Yardeni Research, Inc. 15 Feb 2023